ícone de menu hambúguer
ícone do stories ícone de compartilhar


The crisis caused by the new coronavirus brought a series of challenges to the public sector

In Brazil, different spheres of the government developed and acquired technologies to decrease the risks and damages related to COVID-19. Online applications, artificial intelligence, cameras equipped with multiple functions and data banks were used in all parts of the national territory to monitor the development of the pandemic and avoid more infections. On the other hand, there is little transparency about how these technological solutions work and what are the potential impacts regarding privacy and the security of citizens. In light of this, Data Privacy Brasil Research Association created the project Viral Data aiming to map out digital technologies based on the use of personal data that were adopted during the period of public calamity, gathering information from a wide, fragmented and multifaceted set of public initiatives.

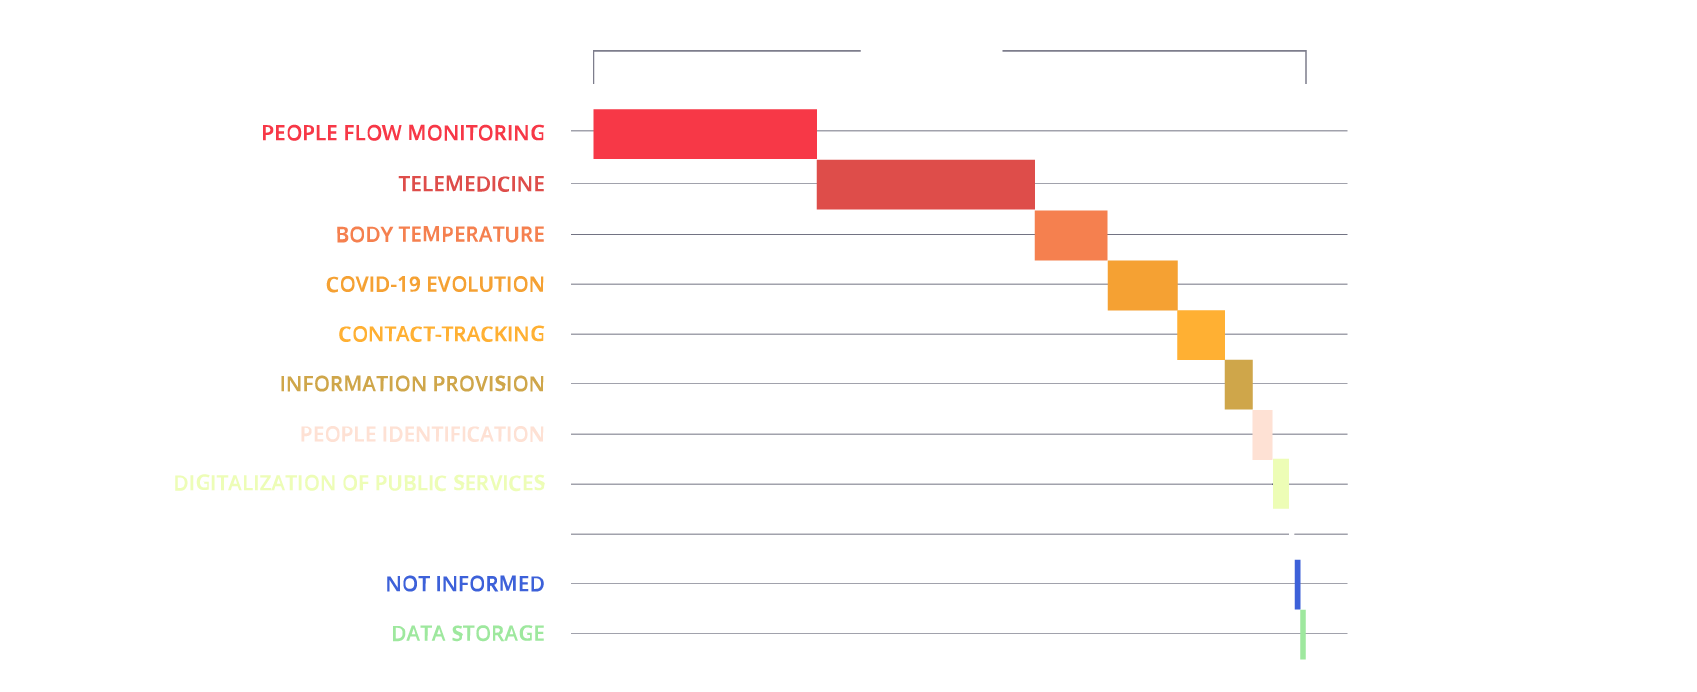
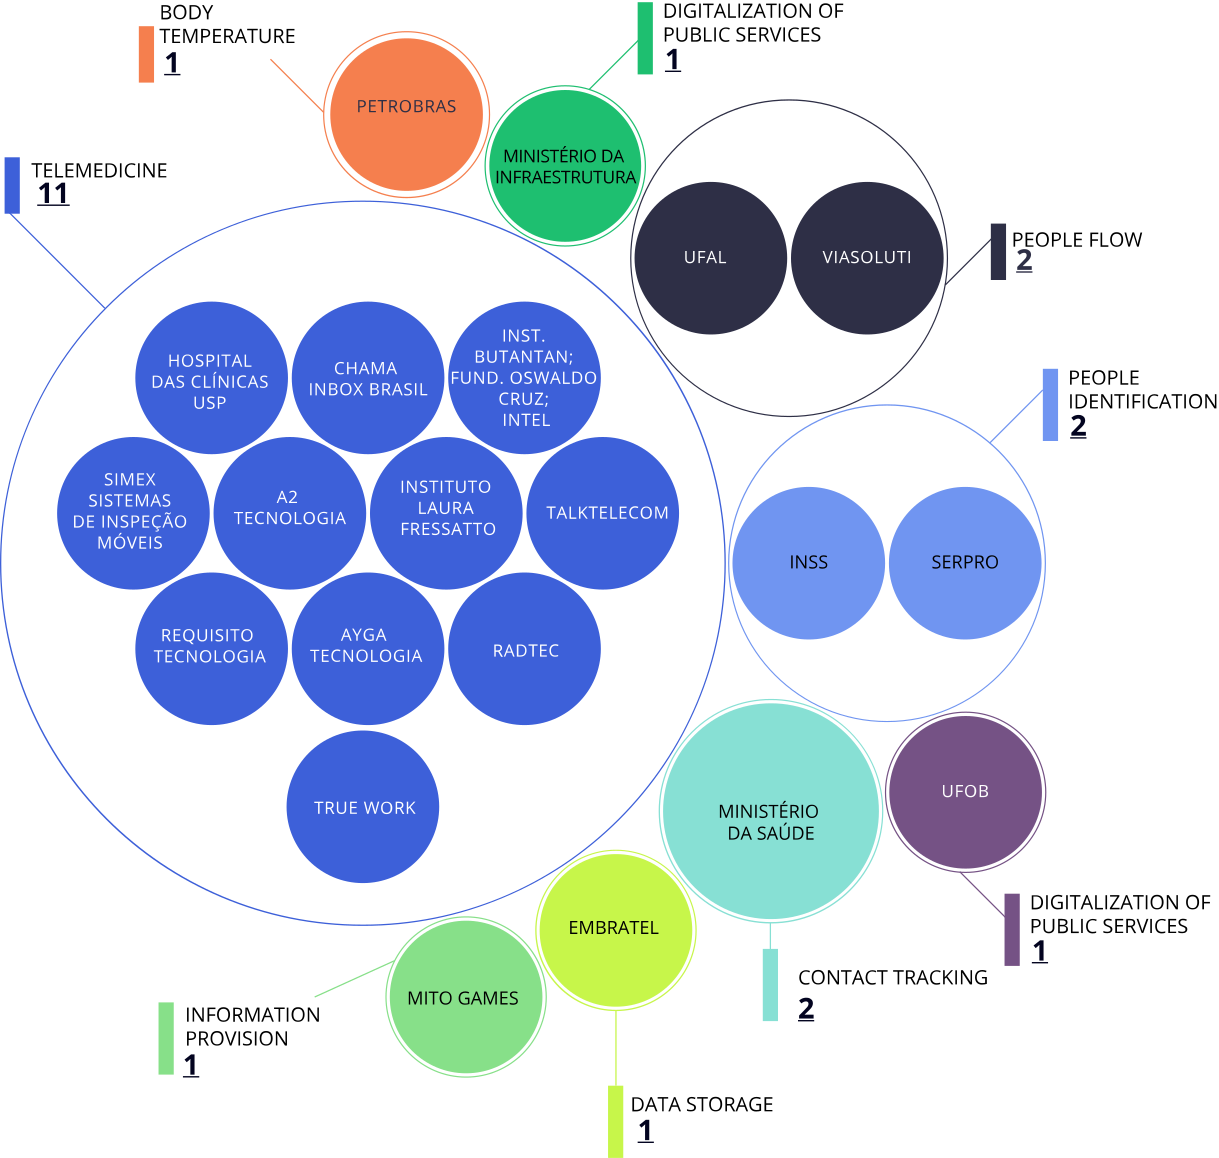
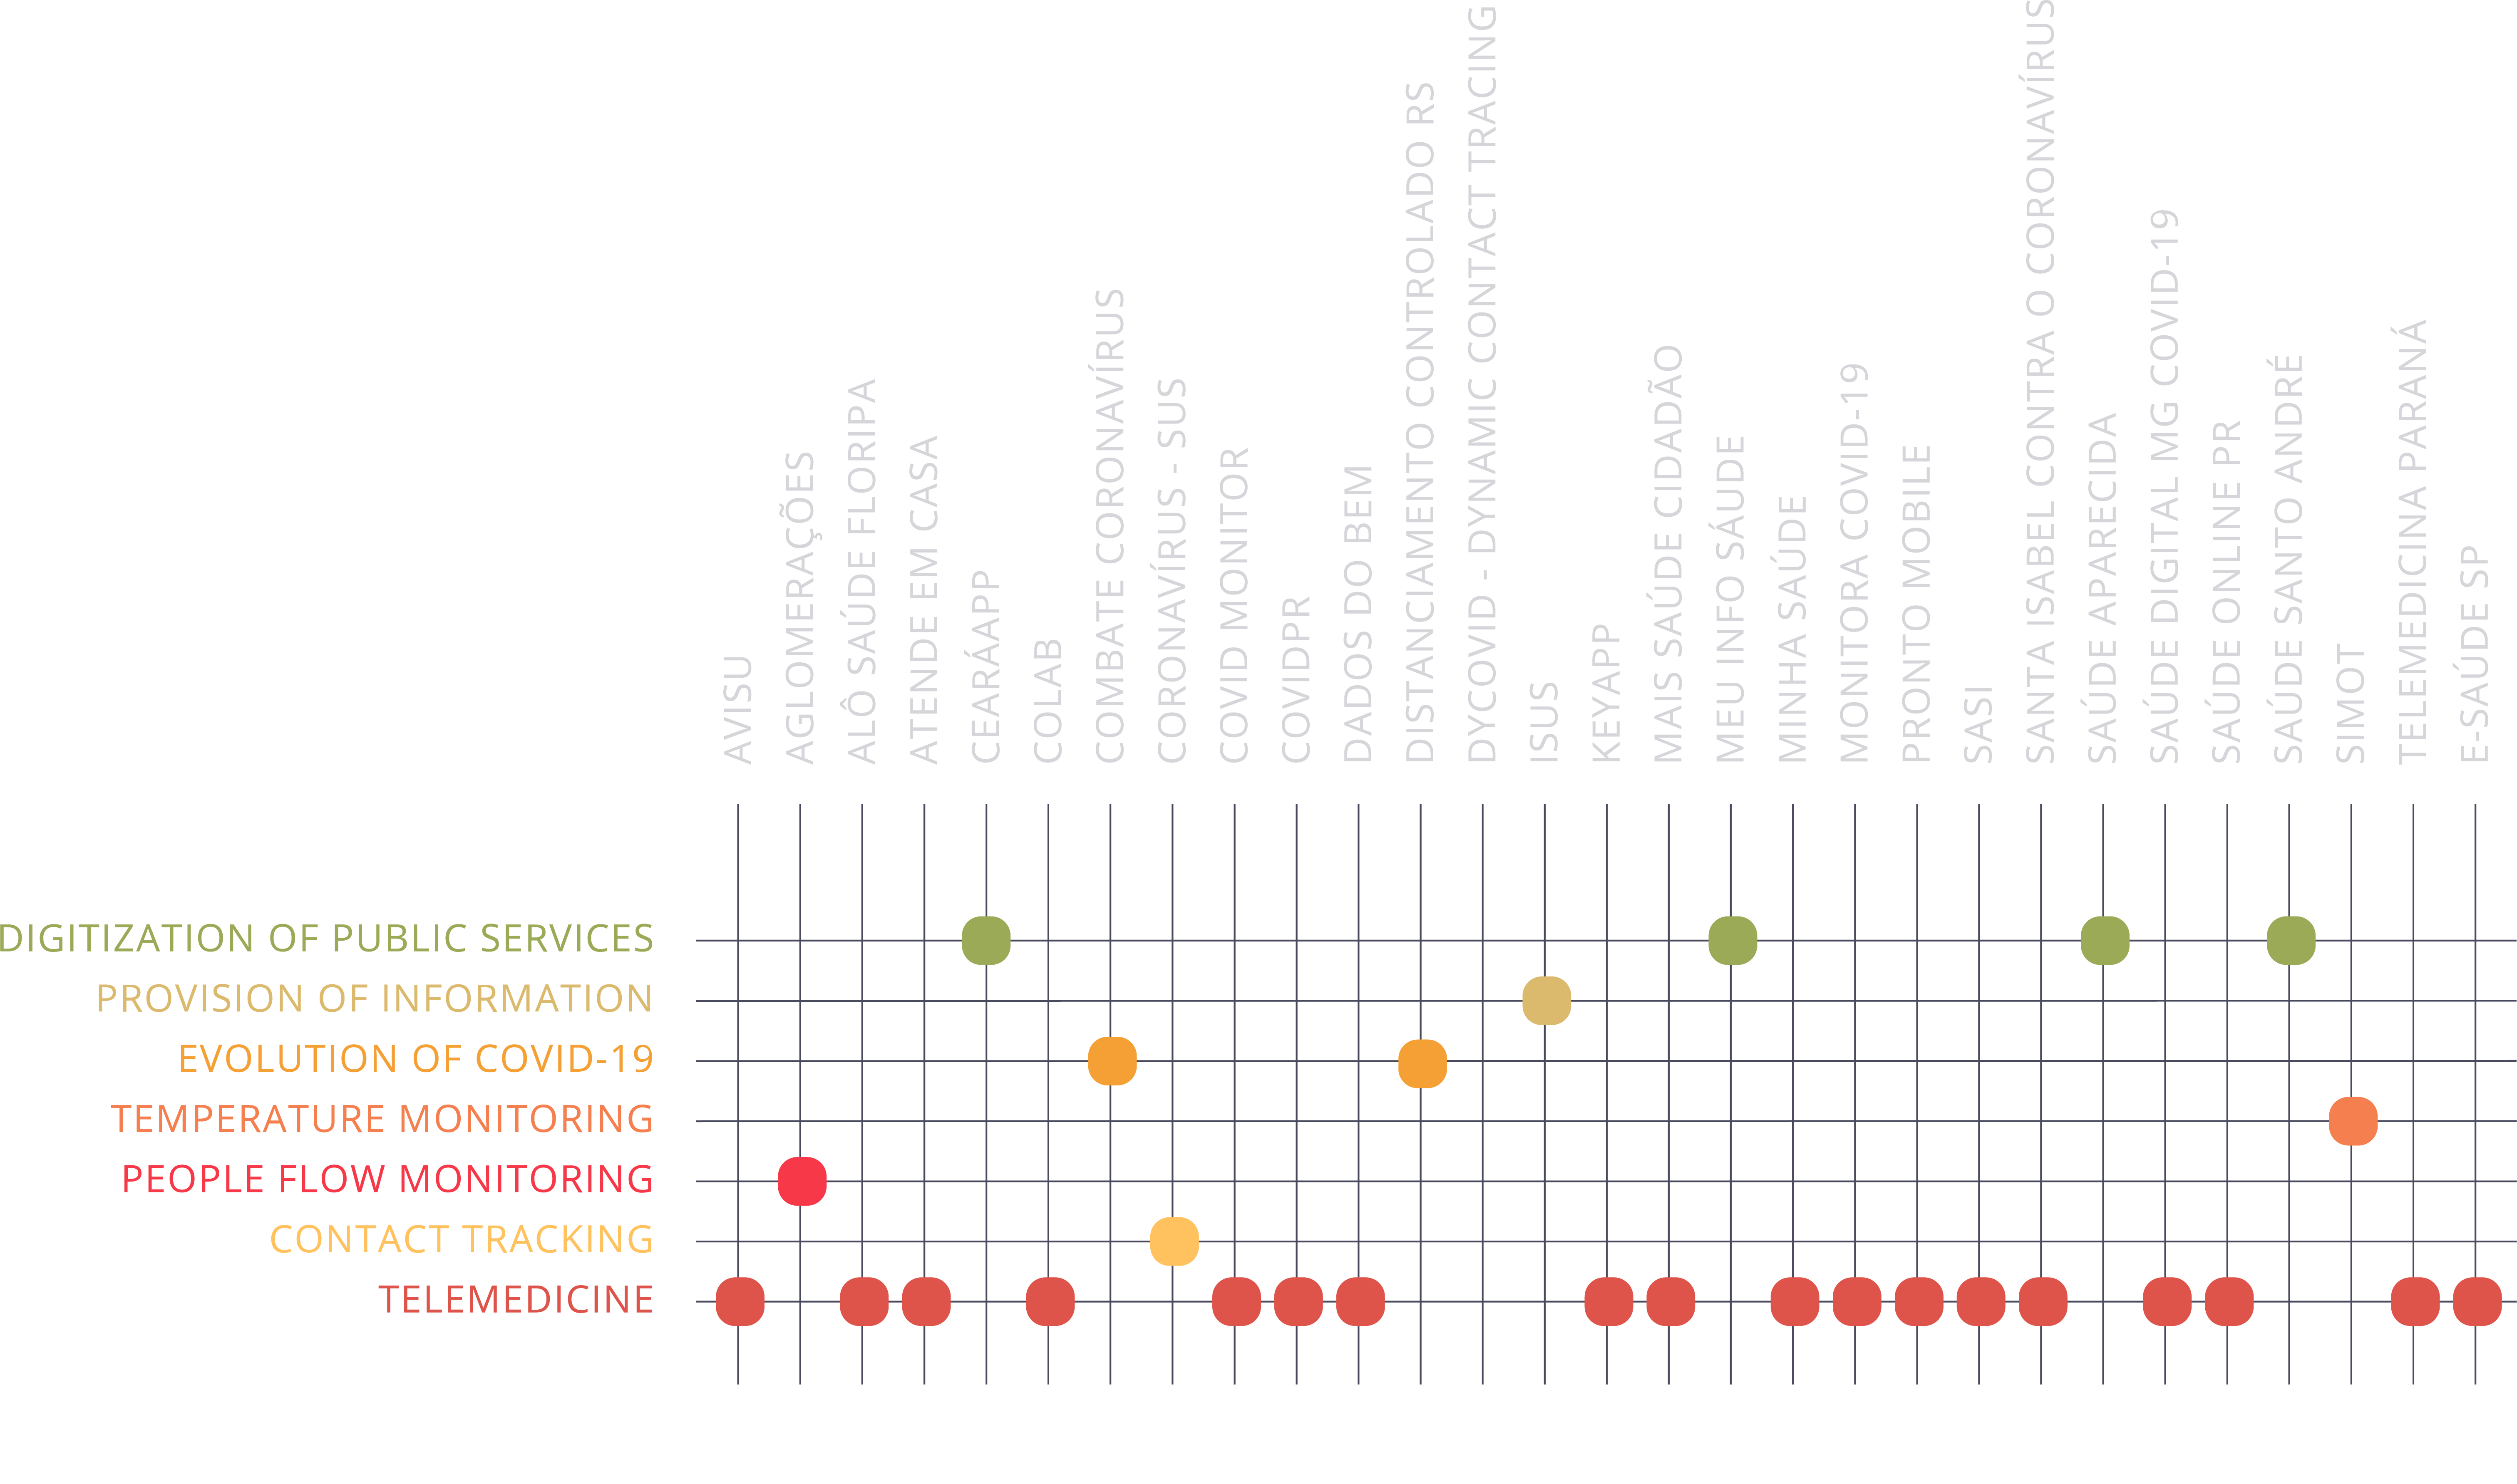
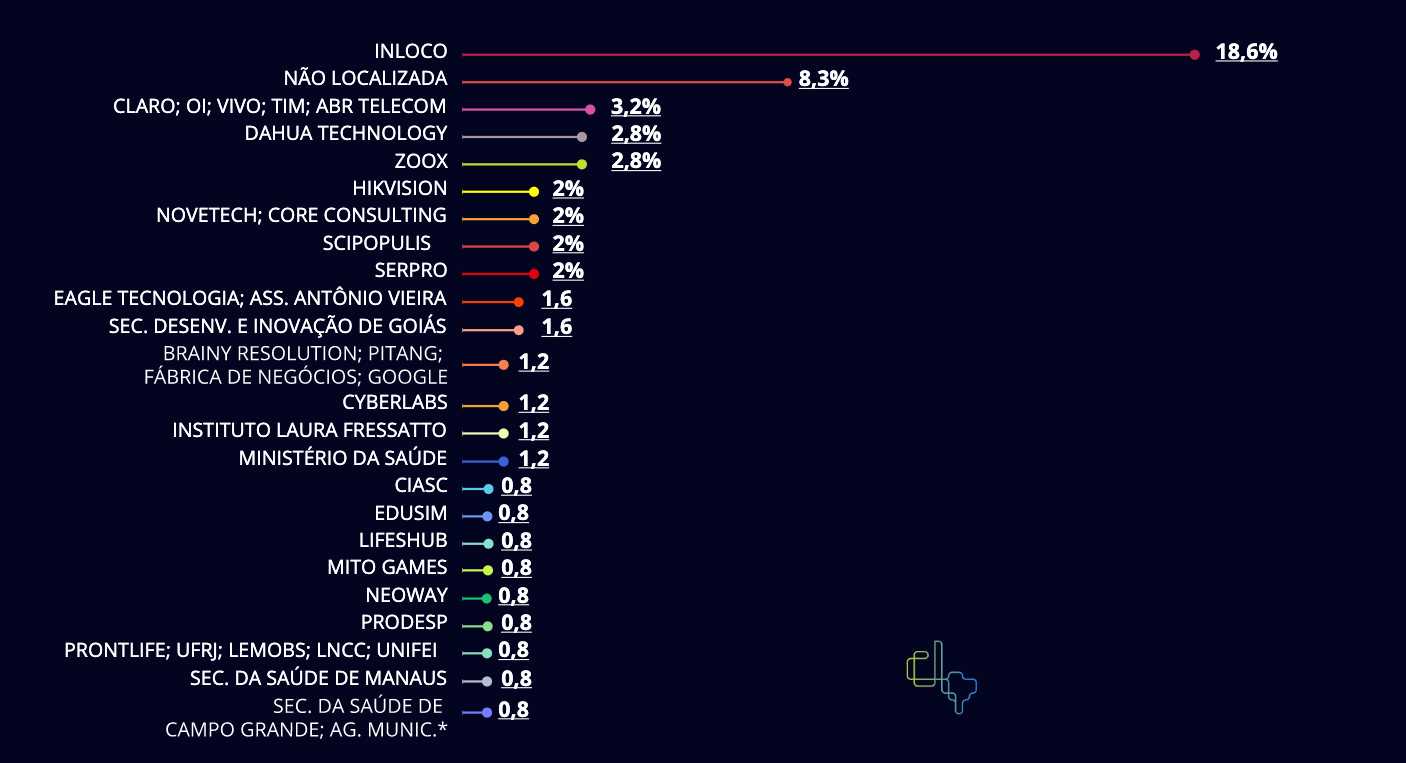
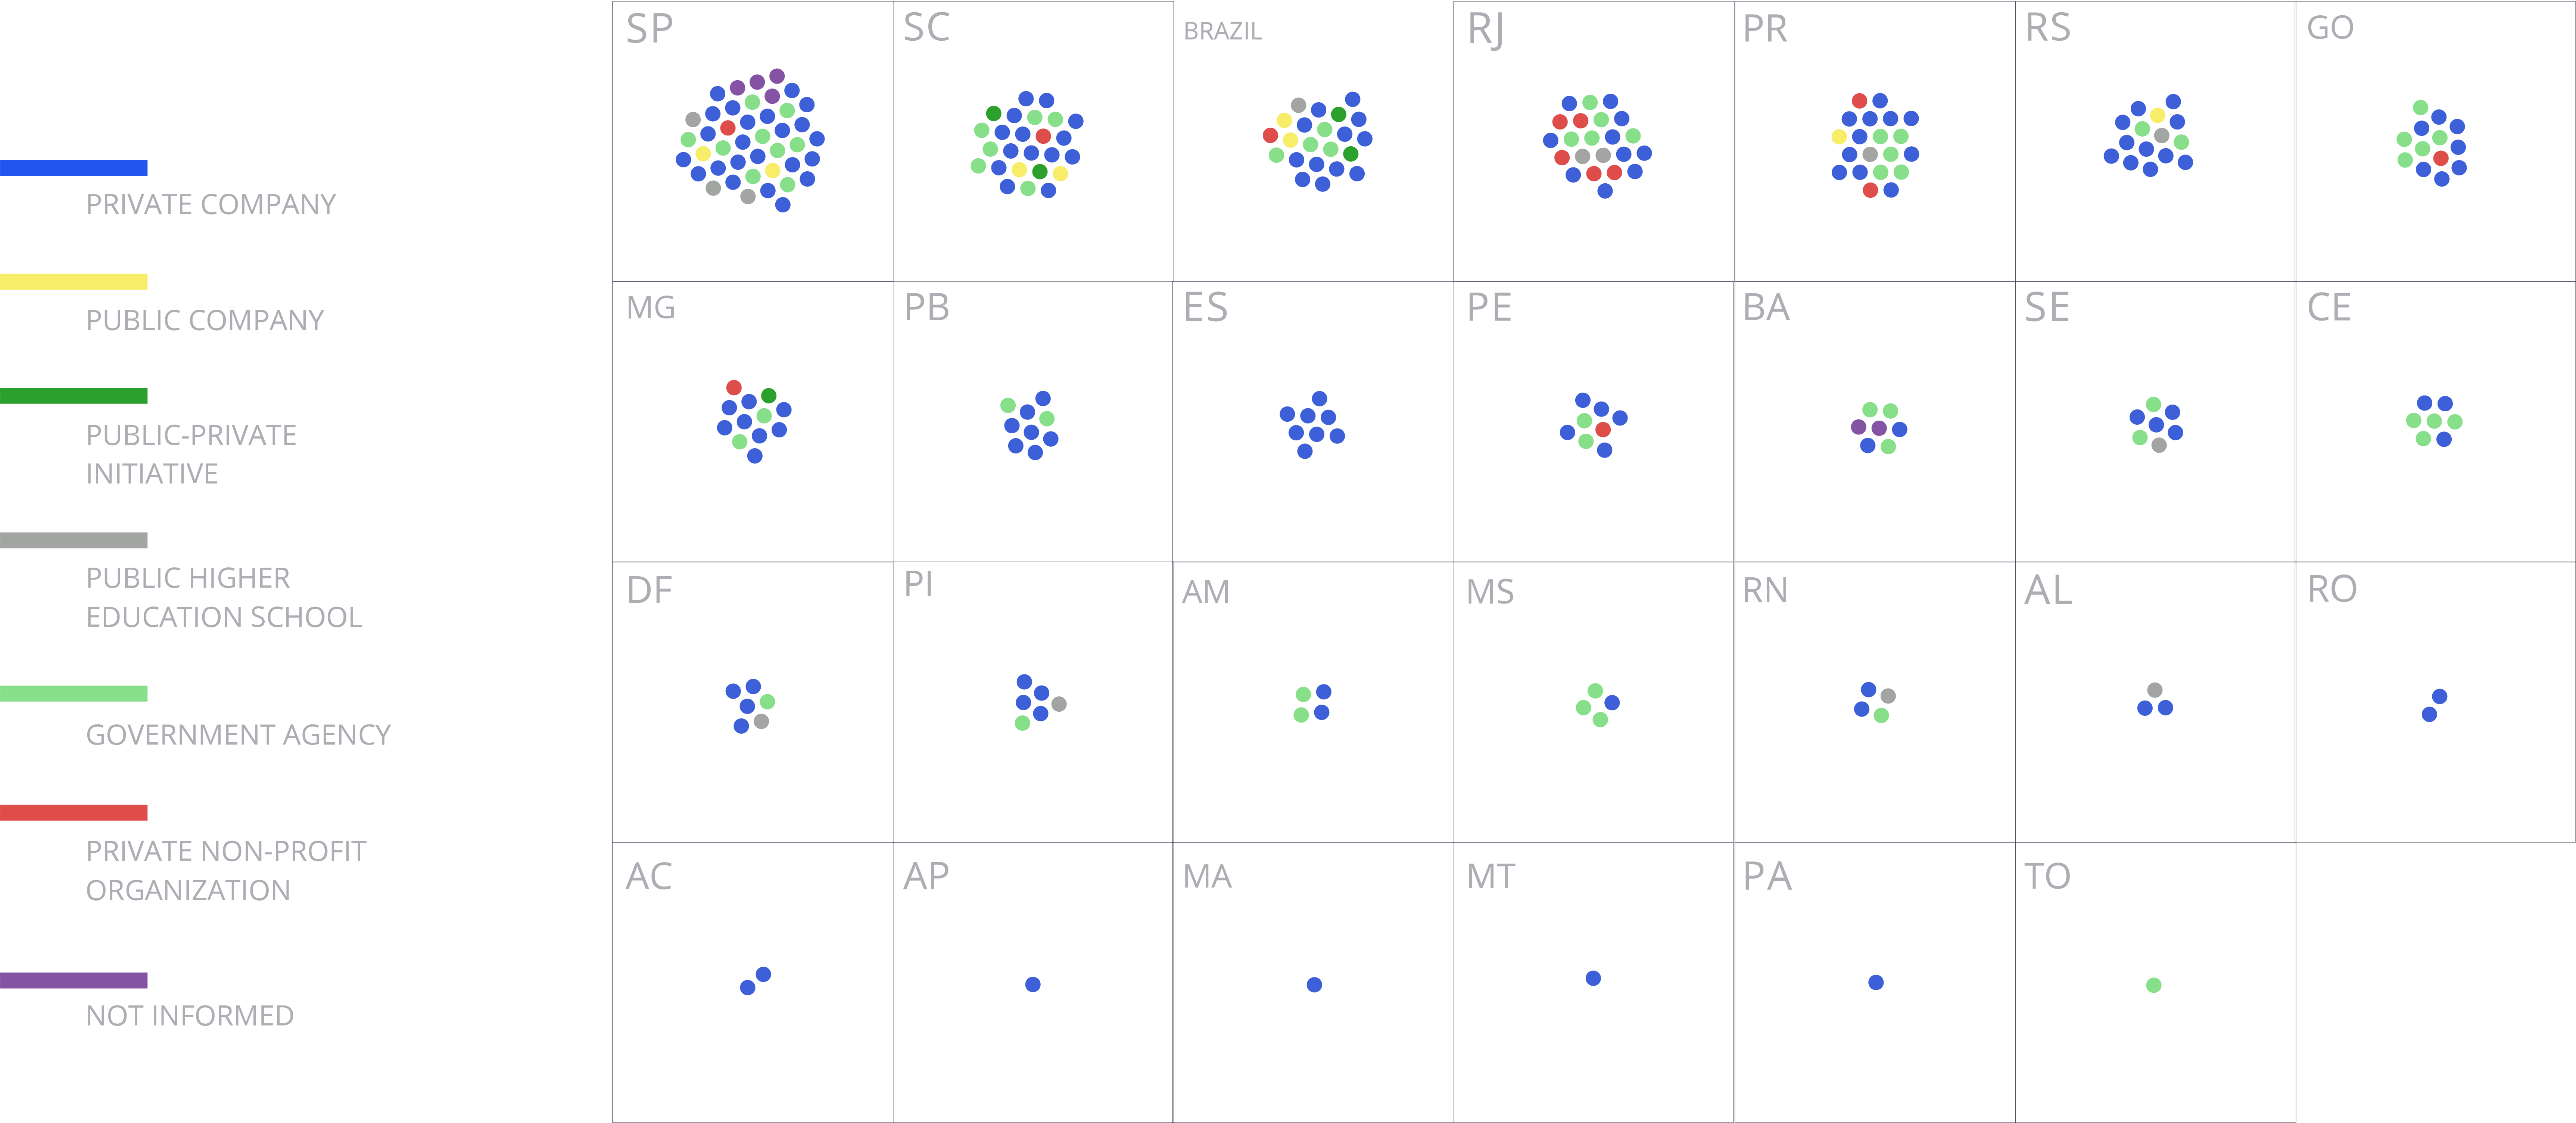
The results present a general panorama of technologies used, locations and scope, players involved in the arrangements with the public sector and the main functionalities associated with the technologies. The main discoveries are shown below:

The technologies mapped out were adopted by municipality, state and federal governments. The results point to 253 initiatives to fight COVID-19 involving the use of personal data based technology. This cases are distributed in:

→ 24 states, corresponding to 100 technologies adopted

→ 77 municipalities, with 131 technologies adopted.

→ 22 products with national reach adopted by the Union or other federal units.


To access the complete results of the research, the adopted methodology and a more in depth analysis, check the report Viral Data: the COVID-19 legacy on technology acquisitions by the Public Sector in Brazil.

State-wide technologies

An interactive map that indicates the number of technologies in each state and its respective functionalities. Data in this map is related only to technologies that are applied state-wide.


The state governments leading the implementation of technologies at the state level are São Paulo (17), Santa Catarina (10), Rio de Janeiro and Espírito Santo (7 each). Ceará, Goiás and Paraná have 5 contracts each. The Southeast region accumulated the highest number of contracts, 33 in total, followed by the Northeast (27) and South (21).

Number of technologies per state and municipalities

The graph allows the interactive visualization of the number of technologies mapped per state and their respective municipalities. Click in the superior bar to return one level.

Number of technologies per municipalities


Among municipalities, the capitals aggregate most of the occurrences of implementation of technologies registered in the study. Some exceptions can be highlighted such as Campinas (SP - São Paulo state), which leads the implementations with 6 technologies, next to São Paulo (SP). The capitals Rio de Janeiro and Recife are next on the list, each with 5 cases. Aparecida de Goiânia (GO - Goiás state) is another exception, having 4 cases, the same as the capitals Porto Alegre (RS), João Pessoa (PB) and Aracaju (SE). Municipalities from regions with more resources, such as South and Southeast, represent 52 out of 69 occurrences, that is to say that only 17 municipalities are not in these regions.

FUNCTIONALITIES OF THE TECHNOLOGIES

The graph allows the identification of the main functions of the mapped technologies.

download de imagem

FUNCTIONALITIES OF THE TECHNOLOGIES FUNCTIONALITIES OF THE TECHNOLOGIES
   

As a highlight, it is possible to observe that the main goals of the public sector when adopting technologies to fight COVID-19 were to monitor people flow (31.6%) and provide telemedicine services (30%). In 10.3% of the cases, technologies were implemented for body temperature monitoring, including the use of photothermal cameras, in some cases also equipped with facial recognition technology. Platforms with data on the evolution of COVID-19 represent 9.9%, including some that had online risk maps based on georeferencing. Contact tracing represented 6.7% of the cases, information provision 3.9%, people identification 2.8%, digitalization of public services 2.4%, mask use monitoring 0.8% and data storage also 0.8%.

TECHNOLOGIES PER MUNICIPALITIES, PLAYERS AND FUNCTIONALITIES

The graph allows the interactive visualization of the correlation between three variables: location in which the technology was implemented, suppliers and functionalities of those technologies. Thus, it is possible to identify what functionalities were applied in a given city, as well as which players supply a given functionality


As a highlight, it is possible to observe that the main goals of the public sector when adopting technologies to fight COVID-19 were to monitor people flow (31.6%) and provide telemedicine services (30%). In 10.3% of the cases, technologies were implemented for body temperature monitoring, including the use of photothermal cameras, in some cases also equipped with facial recognition technology. Platforms with data on the evolution of COVID-19 represent 9.9%, including some that had online risk maps based on georeferencing. Contact tracing represented 6.7% of the cases, information provision 3.9%, people identification 2.8%, digitalization of public services 2.4%, mask use monitoring 0.8% and data storage also 0.8%.

  • 58%

  • Percentage of private companies that supply technologies used by the public sector

  • 253

  • Technologies identified. and adopted in 24 federal units (states)

  • 151

  • Personal data based technology suppliers were identified

TECHNOLOGIES PER STATE AND FUNCTIONALITY

The graph allows the interactive visualization of the technologies’ functionalities placed in the states they were adopted, as well as the number of times they appeared.

TECHNOLOGIES WITH NACIONAL REACH: SUPPLIERS, DEVELOPERS AND FUNCTIONALITIES

The graph presents information on technologies implemented nationally, organized by functionalies, pointing out its suppliers and developers.

APP: FUNCTIONALITIES AND DEVELOPERS

The graph shows the relation between the identified apps and their functionalities.

download de imagem

APP: FUNCTIONALITIES AND DEVELOPERS APP: FUNCTIONALITIES AND DEVELOPERS
   

The use of mobile apps also became widespread, there were 29 occurrences. In 18 of them, the main functionality was providing telemedicine services. The highlight apps were “Dados do Bem” developed by a private enterprise and very popular in Goiás and Rio de Janeiro states, and “Monitora COVID-19” developed by Consórcio Nordeste and contracted with 5 northeastern states (Ceará, Piauí, Maranhão, Bahia and Sergipe). Besides the telemedicine services, the apps identified were used for digitalization of public services (4 cases), mapping the COVID-19 evolution (2 cases), providing information, body temperature monitoring, people flow monitoring and contact tracking (each with 1 case).

INFORMATION ACCESSED BY APPS IN ANDROID SYSTEMS

The graph shows the permissions requested by the identified apps.


To consult the level of risk associated with each type of permission, accessthis table (Google Sheets)

TECHNOLOGY SUPPLIERS

Percentage of suppliers responsible for providing the technology identified.

download de imagem

TECHNOLOGY SUPPLIERS TECHNOLOGY SUPPLIERS
   

In Loco, currently called Incognia, was the most prominent company as a supplier of technology in the pandemic (18.6%) due to the offering of a Social Isolation Rate that was implemented in 47 locations all around the country. Then, with a large margin of difference in relation to the In Loco, appear, ABR Telecom and Instituto D’or de Ensino de Pesquisa, with 8 and 7 locations implementing their technologies (corresponding to 3.2% and 2.8% of the cases, respectively). In 49.8% of the cases identified, the suppliers presented their product in only one location. Therefore, apart from In Loco’s case, the supply of technology in Brazil was very dispersed among a vast range of suppliers, instead of being centered in a handful of players.

TECHNOLOGY DEVELOPERS

Percentage of developers responsible for the creation of technologies identified.

download de imagem

TECHNOLOGY DEVELOPERS TECHNOLOGY DEVELOPERS
   

In Loco (Incognia) and ABR Telecom (together with the telecommunication providers Claro, Oi, Vivo and Tim) are suppliers but also developers of two different Social Isolation Rates. Thus, both In Loco (Incognia) and ABR Telecom lead the list of developers identified at 8.6% and 3.2% respectively.

An important aspect to highlight in the results regarding developers is that in 8,3% (the second biggest rate) of the technologies mapped the team was unable to identify the developer. This result is indicative of flaws in the fulfilment of the transparency principle regarding the disclosure of information related to the technologies implemented by the public sector in the country.

A new observation made based on the results about developers is the presence of Dahua, a Chinese multinational company, that appeared as the third company with the most reach (2.8%), corresponding to 8 of all the cases mapped out. The results of Dahua are related to the offering of thermographic cameras used during the pandemic to measure body temperature. Part of these cameras measure temperature using facial recognition technologies. Since fever is one of the main symptoms associated with COVID-19, the application of these cameras has the purpose of identifying possible individuals infected with the virus. Hikvision, another Chinese multinational company manufacturer of thermographic cameras, appears in the results at 2% of the total of developers, corresponding to 6 of the mapped cases. Like Dahua’s cameras, Hikvision’s cameras measure temperature with facial recognition technology and are capable of doing this procedure even if there is a high number of people passing by, at a distance, and also in real time.

SUPPLIERS’ PROFILE

The graph indicates the concentration of technologies per state and the profile of the suppliers.

download de imagem

SUPPLIERS’ PROFILE SUPPLIERS’ PROFILE

Private companies are the main responsible for supplying technology used by the public sector.

They correspond to almost 60% of the technologies,while public agencies supply around 24%.


In Loco (Incognia) and ABR Telecom (together with the telecommunication providers Claro, Oi, Vivo and Tim) are suppliers but also developers of two different Social Isolation Rates. Thus, both In Loco (Incognia) and ABR Telecom lead the list of developers identified at 8.6% and 3.2% respectively.

An important aspect to highlight in the results regarding developers is that in 8,3% (the second biggest rate) of the technologies mapped the team was unable to identify the developer. This result is indicative of flaws in the fulfilment of the transparency principle regarding the disclosure of information related to the technologies implemented by the public sector in the country.

A new observation made based on the results about developers is the presence of Dahua, a Chinese multinational company, that appeared as the third company with the most reach (2.8%), corresponding to 8 of all the cases mapped out. The results of Dahua are related to the offering of thermographic cameras used during the pandemic to measure body temperature. Part of these cameras measure temperature using facial recognition technologies. Since fever is one of the main symptoms associated with COVID-19, the application of these cameras has the purpose of identifying possible individuals infected with the virus. Hikvision, another Chinese multinational company manufacturer of thermographic cameras, appears in the results at 2% of the total of developers, corresponding to 6 of the mapped cases. Like Dahua’s cameras, Hikvision’s cameras measure temperature with facial recognition technology and are capable of doing this procedure even if there is a high number of people passing by, at a distance, and also in real time.

ACCESS OUR FULL REPORT

CREDITS

Data Privacy Brasil Research Association carried out this project between October 2020 and May 2021. The work counted with the financial support of Open Society Foundation.
Directors: Bruno Bioni e Rafael Zanatta
Head of projects: Mariana Rielli
Research Coordinators: Bruno Bioni e Daniela Dora Eilberg